The previous part of this series served as an introduction to both Roslyn in general and the problem statement, the code smell we will try to tackle with our Roslyn Extension.
This second part will follow up on how we start looking at code and performing
our analysis. We will do this by creating a project based on Analyzer with
Code Fix (.Net Standard) template and make modification to the Analyzer.
After we setup the analyzer the next and final part of the series will look at how we build and apply simple code changes to address our problem.
For full context, the following links (will) point to all the articles:
This post starts looking at the basic out of the box Analyzer that is already setup when we create a new project out of the Analyzer with
Code Fix (.Net Standard) template. After that introductory section we look at the Analyzer setup for our actual problem presented in the Intro
Contents
- Analyzer Recap
- Template Default setup
- Sample Problem Analyzer (Multiple Method Calls)
- In Action
- Summary
Analyzer Recap
Roslyn offers a set of API which allow us to hook into the .NET Compiler pipeline that runs in Visual Studio.
This pipeline includes the Syntax Analysis process which in a sense is constantly running as it’s needed for some of the Key IDE features to work.
For example, Syntax Highlighting in VS needs to know which parts of the text are variables, which are keywords, methods, expressions and so on so it can apply different styles to different types of syntax.
So, we have the option to state the following:
- Roslyn, please tell us when you identify a certain type of Token/Syntax occurring in the code we are writing while you are processing the active source file/project/solution.
We can then to do our own custom/specific analysis once we get notified that what we are interested in has been “detected”. So, let’s have a look how that works by exploring the default template Analyzer.
Template Default setup
Intro and Solution
The template generates a project that addresses a fictional code smell of lowercase names for types. For example, when defining a class
public class
Animal
the analyzer and fix provider will propose we change the class name topublic class ANIMAL.
We start off by creating a new project based on the Analyzer with Code Fix (.Net Standard) template. We name the project UpperCaseType and we end up with a solution that looks a little bit like this:
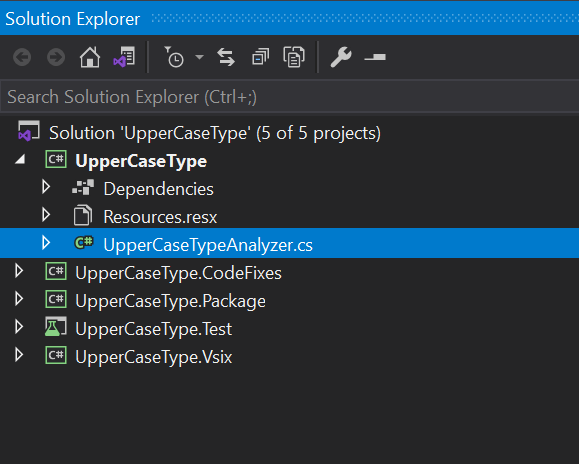
What our focus will be for now is the UpperCaseType project and specifically the UpperCaseTypeAnalyzer.cs file.
{: .box-note} The above solution is generated very close to time of writing using the latest Preview Version of Visual Studio 2019. If running a different older versions your results might be different. Notably the template previously did not have a separate project for the code fix provider. {: .box-note}
Let us now start looking at how we use the types and Roslyn API to register our methods/hooks analysis into the pipeline.
Analyzer Review
The first thing we do to register an analyzer is going to be inherit from the
base class DiagnosticAnalyzer and decorate our implementation with the
DiagnosticAnalyzer attribute setting the language to C#:
[DiagnosticAnalyzer(LanguageNames.CSharp)]
public class UpperCaseTypeAnalyzer : DiagnosticAnalyzer
This allows us to override the Initialize method where we can start using the Roslyn API through the key AnalysisContext parameter provided to us in the method:
public override void Initialize(AnalysisContext context)
{
    // TODO: Consider registering other actions
    // that act on syntax instead of or in addition to symbols
    //
    // See https://github.com/dotnet/roslyn/blob/master/docs/analyzers/Analyzer%20Actions%20Semantics.md for more information
    context.RegisterSymbolAction(AnalyzeSymbol, SymbolKind.NamedType);
}
We use theAnalysisContext ro register an Action with Roslyn.
The example uses RegisterSymbolAction which is described as:
Register an action to be executed at completion of semantic analysis of an ISymbol with an appropriate Kind. A symbol action reports Diagnostics about ISymbols.
At this point we can make a difference between two types of analysis or questions we can ask Roslyn about our code:
- Syntax Analysis & Syntax Related Questions
- Deals with the structure of the code by looking at how code statements/expressions are structured and organized to form our program.
- Primary deals with Syntax Nodes and Syntax Tokens.
- Even though we can analyze multiple files at one given time we can only look at the syntax of a single file.
- Semantic Analysis & Semantic Related Questions
- Deals with the meaning behind the syntax.
- Among other things it is primary construct are the Symbols based on the ISymbol interface.
- The semantic analysis can span multiple files, for example we can get information for variables with types defined in other files.
- We can take a Syntax Node and ask our Semantic Model to provide information about it.
The RegisterSymbolAction therefore registers a callback each time Roslyn
detects a specific semantic changes. In this case when a new Symbol is
detected more specifically a NamedType Symbol specified via the
SymbolKind
enum.
If we had this simple extension running in an instance
of Visual Studio each time we declare a new Type (Class) the callback method,
AnalyzeSymbol would be called.
Analyze Symbol
Let’s now look at how AnalyzeSymbol is structured:
private static void AnalyzeSymbol(SymbolAnalysisContext context)
{
   // TODO: Replace the following code with your own analysis, generating Diagnostic objects for any issues you find
   var namedTypeSymbol = (INamedTypeSymbol)context.Symbol;

   // Find just those named type symbols with names containing lowercase letters.
   if (namedTypeSymbol.Name.ToCharArray().Any(char.IsLower))
   {
         // For all such symbols, produce a diagnostic.
         var diagnostic = Diagnostic.Create(Rule, namedTypeSymbol.Locations[0], namedTypeSymbol.Name);

         context.ReportDiagnostic(diagnostic);
   }
}
We see that we can access the Symbol that was detected through context.Symbol.
The code casts it to the specific INamedTypeSymbol which provides the
following methods and
properties
{: .box-note} The SymbolAnalysisContext is the key “interface we have at this
point with the rest of the Roslyn API. It provides the information we are
interested in as well as the key feature of reporting diagnostics, if we find
that the code analyzed contains an issue we want addressed . {: .box-note}
INamedTypeSymbol is one of many possible implementations of the general
ISymbol interface which provided additional properties and methods depending
on the specific implementation. For more information on the other types of
ISymbol refer to this
link.
The (INamedTypeSymbol) cast is safe and does not run the risk of the
context.Symbolimplementing a different interface because when we registered the SymbolAction we specifically said we are interested only inSymbolKind.NamedType.
So, let’s now have a look at the key part of the code. Checking if this new
Symbol breaks our hypothetical code rule. That is as simple as checking if at
least one character in the Name of the Named Type Symbol is lowercase:
if (namedTypeSymbol.Name.ToCharArray().Any(char.IsLower))
If that is true, all that is left to do is to use the SymbolAnalysisContext to actually report the issue:
Reporting a Diagnostic
As we see we create a Diagnostic through the Diagnostic Class
// For all such symbols, produce a diagnostic.
var diagnostic = Diagnostic.Create(Rule, namedTypeSymbol.Locations[0], namedTypeSymbol.Name);
context.ReportDiagnostic(diagnostic);
There are a couple of things we can go over regarding the reporting.
The Rule
The Rule object is a static property of type DiagnosticDescriptor. It is an object that describes what the Analyzer does and comes pre-built for us through the template.
It’s our interface with some of the UI elements in the Visual Studio IDE when our extension and analyzer is running and reporting diagnostics.
We also use it do define the Category of the diagnostic and the severity. More information about the class can be found here.
public const string DiagnosticId = "UpperCaseType";

// You can change these strings in the Resources.resx file. If you do not want your analyzer to be localize-able, you can use regular strings for Title and MessageFormat.
// See https://github.com/dotnet/roslyn/blob/master/docs/analyzers/Localizing%20Analyzers.md for more on localization
private static readonly LocalizableString Title =
new LocalizableResourceString(nameof(Resources.AnalyzerTitle), Resources.ResourceManager, typeof(Resources));

private static readonly LocalizableString MessageFormat =
new LocalizableResourceString(nameof(Resources.AnalyzerMessageFormat), Resources.ResourceManager, typeof(Resources));

private static readonly LocalizableString Description =
new LocalizableResourceString(nameof(Resources.AnalyzerDescription), Resources.ResourceManager, typeof(Resources));

private const string Category = "Naming";

private static DiagnosticDescriptor Rule =
 new DiagnosticDescriptor(DiagnosticId, Title, MessageFormat, Category,
                          DiagnosticSeverity.Warning, isEnabledByDefault: true, description: Description);
The Location
The location of the issue associated with the diagnostic. This is where we can use the actual namedTypeSymbol analyzed and get the location from its Locations list.
The location is a list because of things like Partial Classes. In that case the named symbol is going to be declared in multiple locations.
The Message Arguments
The third parameter when creating the rule is a list of message arguments. This
is where we circle back to the DiagnosticDescriptor and the MessageFormat
parameter. The arguments we provide will be used in the MessageFormat which for
the starting template is Type name '{0}' contains lowercase letters
And that is basically it! ![]()
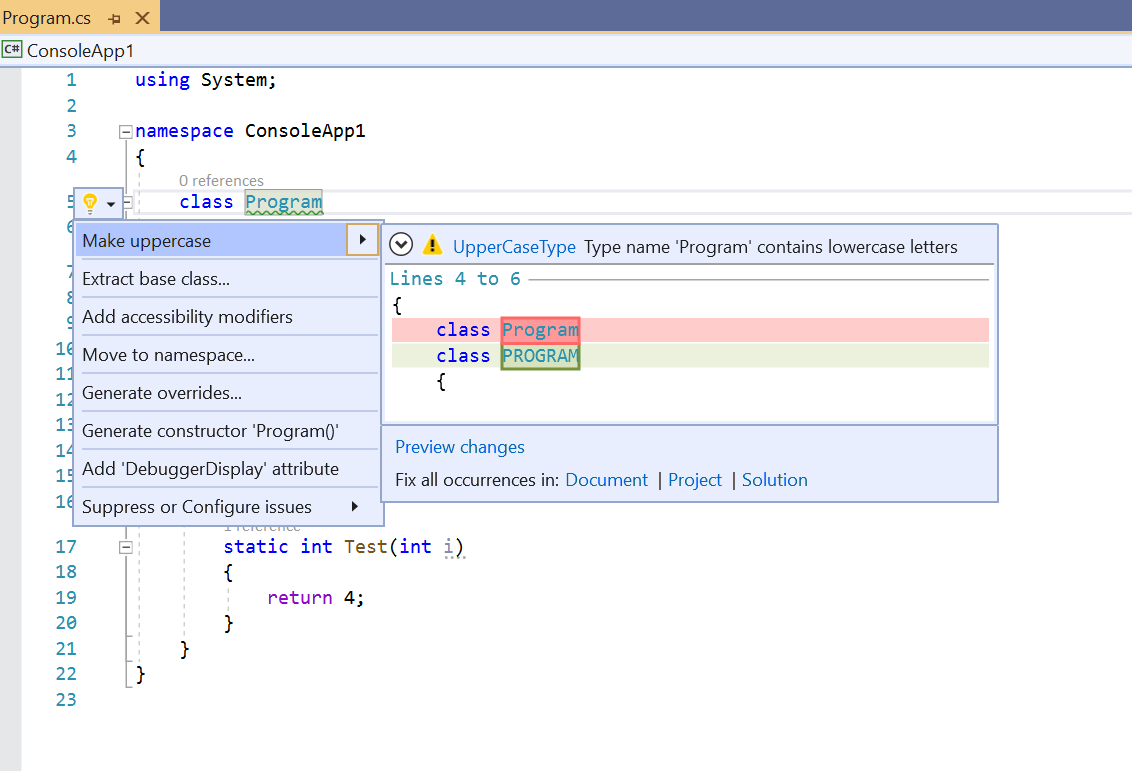
This template project can be published generating an extension installation file. We can also Debug (F5) the .VSIX which will run a “Test” instance of Visual Studio with the extension installed and we can see how the sample analyzer reports the diagnostic:
That covers the review of the Analyzer that comes out of the box with the template. Hopefully it served as a good introduction and anchor point for parallels for the Sample Problem Analyzer we will look at next.
Sample Problem Analyzer (Multiple Method Calls)
Through the basic analyzer in the template we’ve covered a very general/basic example of how Analyzers work.
The analyzer for the problem statement from the previous part of the series will follow this general approach using the same API to register against Roslyn/Compiler actions.
It is just going to be interested in slightly different code “written” events and will slightly expand the actual custom analysis (the lowercase check) to something more interesting!
Reminder of problem statement: We want to be notified if we are unnecessarily calling the same function multiple times within the current scope (method/function) instead of re-using the return results.
A word of caution: The analyzer presented here is not complete! It is a proof of concept for learning purposes and as we will see even ignores certain scenarios and makes simplification & assumptions to illustrate different aspects of the analysis.
Initialize and Register our Callback
We want to start with Roslyn letting us know when method scope has been defined.
We do not care about any function calls in other methods in the same class as We cannot re-use the results from a call across method scopes.
This is where we start making assumptions and simplifications. There is potentially a better & more complicated way
to do this which would cover more advanced scenarios. We focus only on calls within a single method scope for now, but we could potentially expand this to store results
in a class property if for example the class has two methods making the identical call. Additionally, we ignore block scope method calls, for example within if statements, but again nothing is stopping us from expanding the analysis to check for this as well.
To achieve our goal of analyzing code within Method Blocks we are going to use
the RegisterCodeBlockStartAction registration.
Ths is where we deviate slightly from the Template example. If we look at the documentation for RegisterCodeBlockStartAction we see that the callback we need to register cannot report
Diagnostics. It should further register additional callbacks that would do that based on certain conditions:
context.RegisterCodeBlockStartAction<SyntaxKind>(analysisContext =>
{
      if (analysisContext.OwningSymbol.Kind != SymbolKind.Method)
      {
         return;
      }

      // create a new analyzer for this code block
      var analyzer = new StatefulNodeAnalyzer();

      analysisContext.RegisterSyntaxNodeAction(
         ctx => analyzer.AnalyzeSyntaxNode(ctx, analysisContext.CodeBlock),
         SyntaxKind.InvocationExpression);
});
What we are doing here is saying that any time a Code Block
(CodeBlockStartAction) which is a Method (the OwningSymbol.Kind check) is
analyzed we register a SyntaxNodeAction that will only look at SyntaxNodes of
type SyntaxKind.InvocationExpression!
InvocationExpressions syntax is exactly what we are interested in as it is how function calls are represented.
Here we have the next slight difference from the template example. We create our own
custom StatefulNodeAnalyzer and manually invoke the AnalyzeSyntaxNode method
by also passing the CodeBlock provided from the RegisterCodeBlockStartAction
AnalysisContext.
We do this because we want to restrict where we search/analyze multiple method invocations.
We are now in a position where:
- We’ve stated that we want to know when C# Method Code Blocks
- When dealing with such Method Blocks, we register a SyntaxNodeAction only for InvocationExpressionSyntax
- When such InvocationExpressionSyntax is found (a method/function call is encountered) we run the custom
AnalyzeSyntaxCodemethod. - We pass the Method Code Block through to
AnalyzeSyntaxCodeas it will help us narrow down the search of a multiple calls.
One of the more useful resources when exploring the approaches for
defining the Analyzer described here were the Roslyn SDK Samples
Repository
where the initial idea for the StatefulNodeAnalyzer was found. Note that
our Analyzer currently does not depend on a state that has to be kept in the
StatefulNodeAnalyzer class, but we kept the separate class method to
keep track of the method code block.
Analyzing & finding multiple method calls
Now let us look at the AnalyzeSyntaxNode method by breaking down and exploring bigger sections of the code that deal with their own concerns with the analysis.
We will also see that we will not be just looking at only pure Syntax, but also analyzing the Semantics and meaning of some of the code.
Note: One important practice is to stop analyzing as soon as possible to improve performance. That is reflected in the code bellow which runs small quick checks trying to determine as soon as possible that there is no problem with the code.
Gathering Initial Information and Checks
The definition and starting lines of code for the AnalyzeSyntaxNode method:
public void AnalyzeSyntaxNode(SyntaxNodeAnalysisContext context,
         SyntaxNode methodCodeBlock)
{
         // we are going to run the analysis in the context of the code block
         // which for us would be the method.
         //
         // We want to search for any invocations within that method code block - for now!

         var semanticModel = context.SemanticModel;

         var node = (InvocationExpressionSyntax)context.Node;

         var methodSymbol = (IMethodSymbol)semanticModel.GetSymbolInfo(node).Symbol;

         if (methodSymbol != null && methodSymbol.ReturnsVoid)
         {
            return;
         }

         // ....
         // .... More code to follow!

}
We start the analysis by getting the Semantic
Model
and the InvocationExpressionSyntax Node (which is very similar as in the basic
example).
The next line:
var methodSymbol = (IMethodSymbol)semanticModel.GetSymbolInfo(node).Symbol;
Queries the Semantic model for information about our InvocationExpression
Syntax node.
What we expect to get is a IMethodSymbol implementation.
This object, if available, will give us meaningful information about the method we are looking at.
So, how does this work exactly. There are several things/steps to note:
- Within our code block we encountered Syntax which as we can tell is an invocation of a Method/Function!
- Syntax cannot tell us anything about the Method and we even do not know if the file we are analyzing contains the syntax for declaring the method. The method can be declared in a different file.
- That is why we use the
SemanticModelwhich “operates” beyond just this single file/method. - If the method has been declared properly the Semantic Model would have encountered it and would have built its knowledge around it.
- When it gets asked to
GetSymbolInfofor ourInvocationExpressionSyntaxnode the semantic model can reason about the expression and tie it to a Symbol (method definition) it knows about.
From here the first thing we check is if the Method returns void (using
ReturnsVoid) or in other words does not return anything. This is important for
solving our problem statement by re-using the returned value of the first encountered call call.
We stop further analysis if there is no return type as we cannot actually provide a solution to the code-smell! This circles back to the optimization argument of stopping as soon as possible. No diagnostic can be reported if the invoked function does not return anything no matter how many times it is called.
Note The
IMethodSymbol
refers to the “definition” of the method. The value of the ReturnsVoid
property is not going to change regardless of where or how many times we call
the method. Some additional interesting properties present on the interface are IsExtensionMethod, IsOverride and many others!
Counting how many times we invoke the function
The next block of code in the analyzer checks if we have a problem to solve based on the key problem statement of multiple calls.
At this point we know that the method/function returns a value, but if the function is only called once, there is nothing further to analyze and solve.
We do several checks, again in order to optimize the types and counts of different checks and traversals through the syntax.
Each previous check creates a list of method invocation within the block that feed the next check which then further refines the conditions that must be met for us to conclude a problem occurring:
// ----
// ---- Previous Code

// Traverse the code block
var allInvocationExpressions =
   methodCodeBlock.DescendantNodes().OfType<InvocationExpressionSyntax>().ToList();

// If there are no other invocations except the current one tracked by the 'node'
// don't do any other processing.
if (allInvocationExpressions.Count == 1)
{
   return;
}

// We want to get only the nodes that refer to the same function I'm checking for in the current
// method block.

// If for example we had a call to OurMethod(input) and Console.WriteLine()

var currentNodeExpression = node.Expression.ToString();

var invocationsOnlyWithCurrentNodeExpression =
   allInvocationExpressions.Where(expressionNode =>
      expressionNode.Expression.ToString().Equals(currentNodeExpression)).ToList();

// if we end up with  1 then there are no other invocations matching current node.
if (invocationsOnlyWithCurrentNodeExpression.Count == 1)
{
   return;
}

// Now we get the invocations that are not the Current one by looking at
// the location where they start in the code block
var otherInvocationsMatchingCurrent =
   invocationsOnlyWithCurrentNodeExpression.Where(inv => inv.Span.Start != node.Span.Start).ToList();

// ----
// ---- More Code
First, we check if there is at least one more InvocationExpression Syntax Node for any method within the same method code block. If our current method is the only call we stop further analysis.
We do this by checking the count on the DescendantNodes() of the
methodCodeBlock (we made sure we passed that when registering our action) of type InvocationExpressionSyntax.
The code and comments make references to current node or current method. That refers to the fact that the analyzer code has been invoked specifically after the engineer has typed/completed code that expresses a method call. He might have written such code before and he will probably write such code after and each time this analysis will run, and we can look at the previous/other methods he has written within the method code block
If we have multiple method/function calls within the code block we check if the InvocationExpressions we found (at least one or multiple) match or invoke the same method that is being invoked with the current invocation syntax.
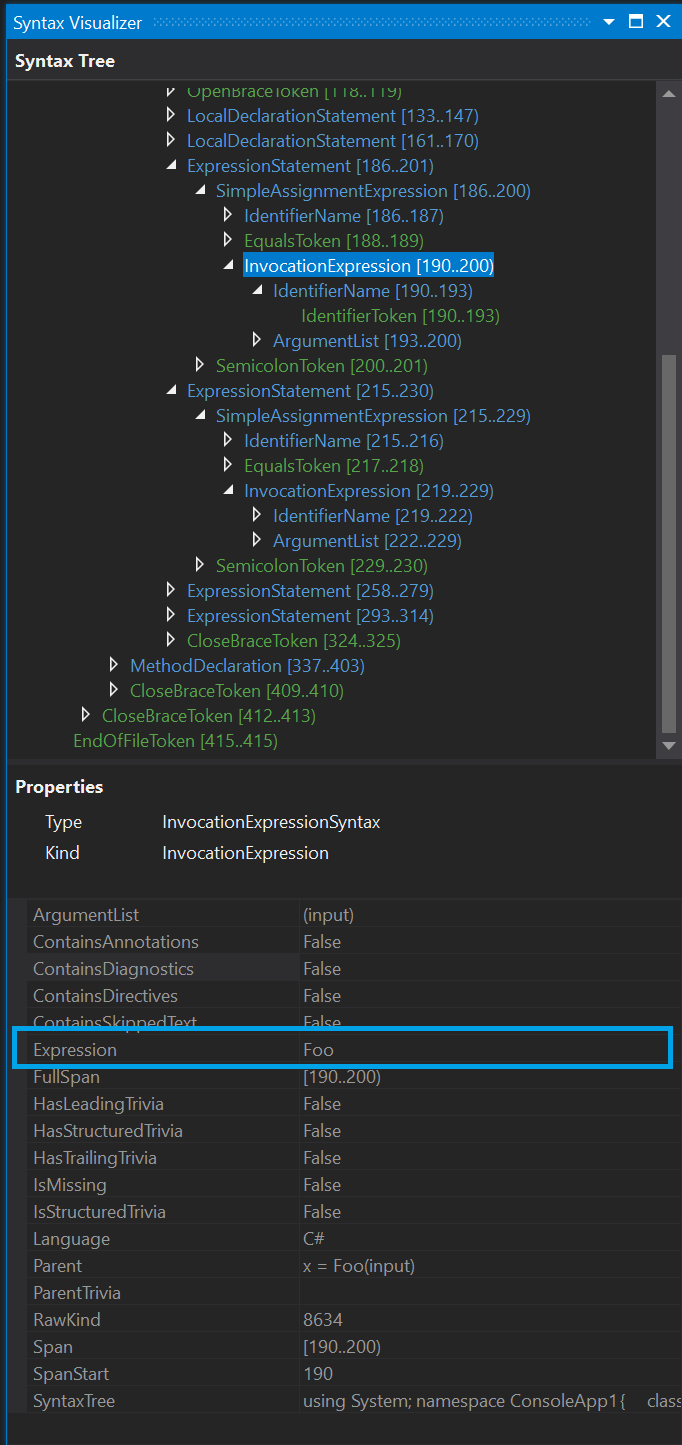
We do this by looking at the expression property and filter the
allInvocationExpressions from the previous check to only those with the same matching
Expression property. To illustrate, let us look at the Expression value of the
Foo method calls as seen in theSyntax Visualizer:
class Program
{
   static void Main(string[] args)
   {
      var input = 4;
      int x, y;

      x = Foo(input);
      y = Foo(input);

      Console.WriteLine(x);
      Console.WriteLine(y);
   }

   static int Foo(int i)
   {
      return 4;
   }
}
Based on that, from here we need a simple filter on that property to give us all the invocations within our code block that are calling the same method.
If it is still just one such method (the current one) we stop analyzing.
If there are multiple such calls (>1) at this point it means that:
A method that returns a value has been called multiple times within this code block.
Unfortunately, this is still not enough for us to determine that there is a problem with our code. It could very well mean that each call is using different parameters/arguments & values. It is reasonable to assume that if a method has been called multiple times with different parameters the multiple invocation has been intentional and we expect different results.
We will take the analysis a step further and check if all the other invocations we found (besides the current one) have the same argument list.
For that we create the otherInvocationsMatchingCurrent list which is created
by filtering on the Span.Start property to only get the invocations that are
not the current node based on the occurrence (start) in the code block.
Warning: Even with the argument check this is by no means a complete solution to the analysis. I don’t even think that for such a problem a complete full-proof, “Yes these X method calls always return the same result” is even possible. For starters we can consider the opposite of Pure Functions and the challenge they present for the approach. So, we can present the analysis findings and fixes as a “For your consideration” proposal and allow the engineers to make the right calls of applying the fix or ignoring the diagnostic.
Checking Arguments and Reporting Diagnostics
We are now quite close to making our final decisions. Let us have a look at the final part of the code that builds on the otherInvocationsMatchingCurrent:
 // simple argument matching
var currentArgumentsList = node.ArgumentList.Arguments;

var invocationsWithMatchingArgumentList = otherInvocationsMatchingCurrent.Where(inv =>
   ArgumentListsMatch(currentArgumentsList, inv.ArgumentList.Arguments)).ToList();

if (invocationsWithMatchingArgumentList.Count > 0)
{
   var methodName = node.Expression.ToString();
   var argumentList = node.ArgumentList.Arguments.ToString();

   var diagnostic = Diagnostic.Create(Rule, node.GetLocation(), methodName, argumentList);

   context.ReportDiagnostic(diagnostic);
}
Here we use the ArgumentList.Arguments property on the
InvocationExpressionSyntax
nodes for the current node/call and all the other matching Invocation
Expressions (otherInvocationsMatchingCurrent).
We are looking for at least one of the other Invocations to have a matching
argument list, a check done in the ArgumentListsMatch helper method.
Let us take a look at that method next, before circling back to reporting the diagnostic.
private bool ArgumentListsMatch(SeparatedSyntaxList<ArgumentSyntax> originalArgumentList,
      SeparatedSyntaxList<ArgumentSyntax> toMatchArgumentList)
{
      if (originalArgumentList.Count != toMatchArgumentList.Count)
      {
         return false;
      }

      for (int i = 0; i < originalArgumentList.Count; i++)
      {
         var originalCandidate = originalArgumentList[i];
         var toMatchCandidate = toMatchArgumentList[i];

         if (originalCandidate.Expression.ToString() != toMatchCandidate.Expression.ToString())
         {
            return false;
         }
      }

      return true;
}
The method operates over two
[SeparatedSyntaxList
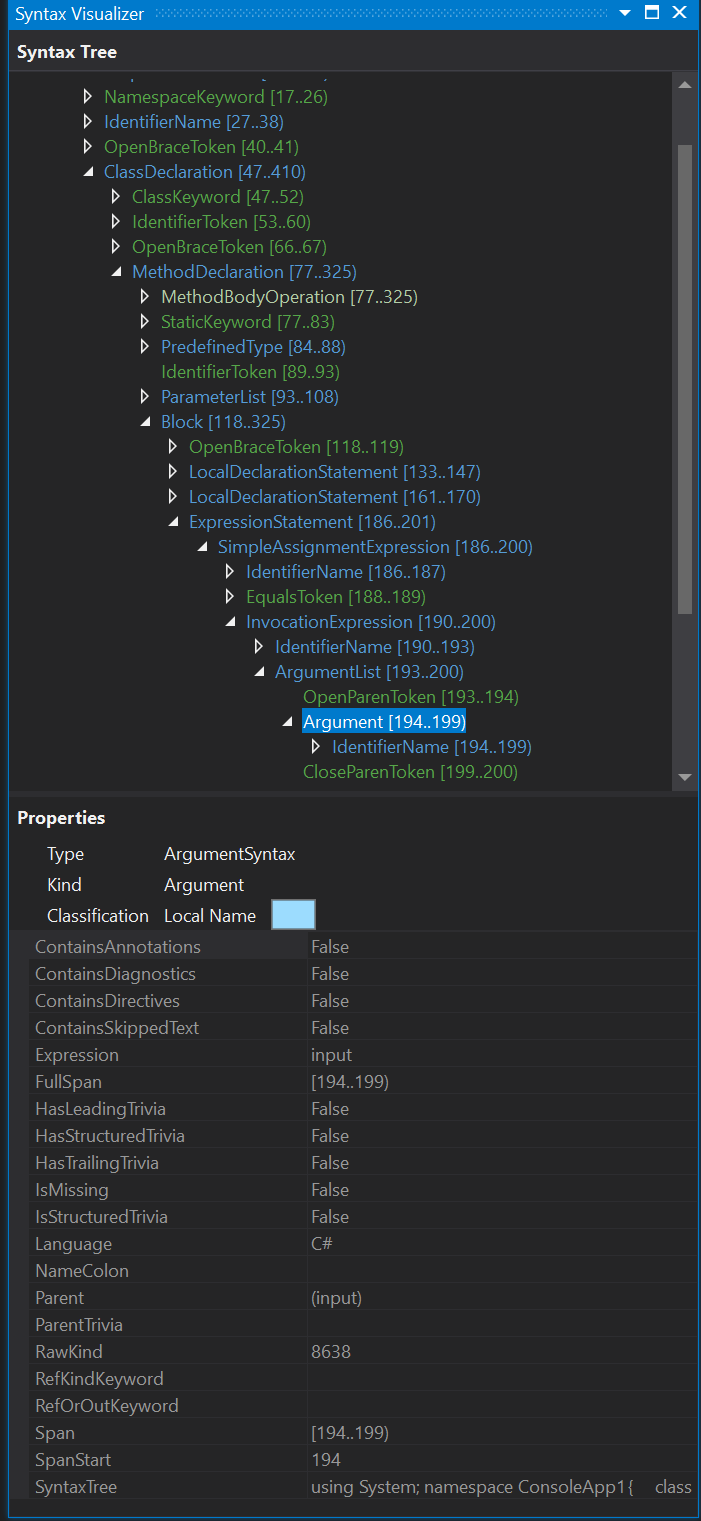
The check is very simple and is based on the number of arguments and the
ArgumentSyntax Expression property. Once again we can look at the SyntaxAnalyzer and use the Foo() method from the previous example to see how the
properties of an Argument in the Argument List are described:
For the purposes of the article we will leave the check to only look at the expression. There is more that can be done here and expand/improve the check, by potentially also looking at the Semantic Model.
{: .box-warning} Warning: The argument check is also not complete and would
not cover all scenarios to fully identify if the argument lists match. The check
also ignores the “value” aspect. The check would work when we are dealing with
literals like: Foo(2) or Bar("Input Parameter") but it would fail if we deal
with the same “value” passed by a different name. This is an area
that could use some improvement in the future in terms of using data flow
analysis (semantics) and potentially presenting flagged cases to the engineer
as something to be resolved within their discretion. {: .box-warning}
Reporting Diagnostic
If the simple argument check finds that the methods are invoked with the same arguments we can proceed to report an issue.
The Diagnostic report has nothing out of the ordinary when compared to the
sample/template reporting. We still need to define a Diagnostic Descriptor which in our case can be defined as:
public const string DiagnosticId = "MultipleMethodCallDiagnosticAnalyzer";

private static readonly string Title = "Multiple Method Invocation";

public static readonly string MessageFormat =
   @"{0} called multiple times with identical arguments: [{1}]";

private static readonly string Description = "Multiple Identical Method Invocation";

private const string Category = "Usage";

private static readonly DiagnosticDescriptor Rule = new DiagnosticDescriptor(DiagnosticId, Title, MessageFormat, Category, DiagnosticSeverity.Warning, true, Description);
We then use the rule within the arguments match if block:
var methodName = node.Expression.ToString();
var argumentList = node.ArgumentList.Arguments.ToString();

var diagnostic = Diagnostic.Create(Rule, node.GetLocation(), methodName, argumentList);

context.ReportDiagnostic(diagnostic);
The slight difference here is the amount of Message Arguments and how we get the
Diagnostic Location, through using the
GetLocation()
method on the
InvocationExpressionSyntax
class object.
Note: Remember that the analysis is constantly running so in
the simple case of the double Foo() method invocation we will actually report
two diagnostics in two different locations where we call the method. After we
finish writing/coding the second call - our code detects a duplicate in the
first method call. The analysis also would run on the first method as well,
which now will consider the second call as the duplicate! ![]()
In Action
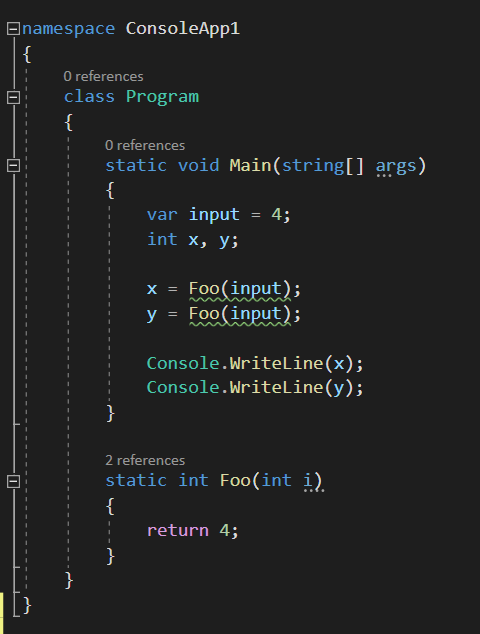
So let’s see this in action, using our sample Foo() method program. For this
we can either Debug or Build the .Vsix project. If we build it the output
folder will contain a .vsix extension we can install to Visual studio and it
would run in the background as we write code!
Getting back to our sample code after we’ve setup the extension in either way,
we can see that both the methods have a warning squiggly line underlying the
invocations:
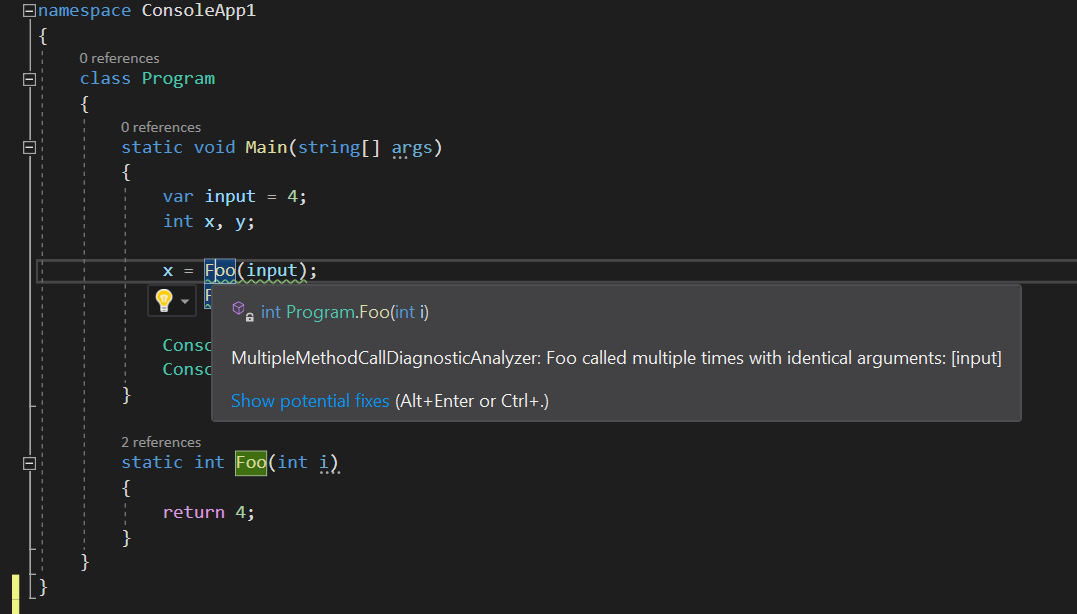
And if we hover over either of the two warnings we get, as expected, we get the full
IDE experience reporting our diagnostic:
Summary
We now have a simple Analyzer that reports diagnostics when we find methods that return values being invoked multiple times with the same arguments within a method code block.
Our analyzer generates diagnostic objects which point to a specific location in
our code. These diagnostics have the DiagnosticId value of
MultipleMethodCallDiagnosticAnalyzer. By using ReportDiagnostic we’ve
registered these with the Roslyn Pipeline.
In the next part of the series we take our “Extension” a step further by seeing
how we can now register code that would “listen” and action our reported
diagnostics by continuing to user the Roslyn API to specifically address
MultipleMethodCallDiagnosticAnalyzer diagnostics.
The full Analyzer file can be found here!